Background

Motivation

I am a third-year Atmospheric Science major and I am very interested in climate change and how it will affect peoples’ lives. I am also very interested in the intersection between arts/social issues and science. I chose to do this project as it speaks to both of those interests. Through my classes the last few years, I have learned about climate change, and sea-level rise. I have looked at predictions and different models and different factors and ice amounts and a number of other variables and variations. I have not spent much time looking at how climate change will affect humans and the social impact, and am very interested in that.

We are seeing right now how higher vulnerability individuals are put at higher risk during natural disasters, changed to their lifestyles, pandemics. COVID-19 is highlighting how individuals with no stable shelter, with lower income, at a higher age, will need more help in recovering from this. Climate change will be no different. Having $10,000 worth of damage on a property due to a rising sea level, or even a flood, will affect individuals with an income of $40,000 a lot more than someone that is making a 6 or 7-digit annual salary. I am very interested in looking at the social divide for climate change and seeing if it is apparent in Vancouver.

Image of Downtown Eastside in Vancouver
Figure 1: West Hastings Street in Vancouver, CTVNEWS

C40 Cities

C40 Cities is an organization that connects 96 cities around the world in trying to address and mitigate climate change. They have participation standards that require cities to have greenhouse gas reduction targets, climate strategy plans, and engage in the C40 Cities community. Vancouver, New York, London, and Tokyo are all members. Oslo has committed to reducing their greenhouse gas emissions to 36% below 1990 levels. To achieve that, the Mayor and city council are considering the environment and climate change in every decision that they make. They have 100% renewable energy and have reduced emissions by 7% from 1990 levels. This is the kind of program that C40 Cities wants to see around the world in order to work together to fight climate change.

Staying Afloat: The Urban Response to Sea Level Rise

In one report from C40 Cities, they look at how Sea Level Rise will affect cities across the world. The thumbnail to the right is an image that they created, with the larger circles showing which cities have larger populations that are at risk of sea level rise. Vancouver is listed with a relatively small and green circle. In the US, New York City appears with a large red circle. This means that there is an urban population of more than ten million people at risk from climate change. New York is a high risk city for sea-level rise. In 2012, when Hurricane Sandy struck the city, it caused more than 19 billion dollars in damage. There are many cities across the world that are higher risk than average in regards to sea-level rise. In Dar es Salaam, in Tanzania, 8% of the city’s population already live below sea-level. This puts 143,000 people at risk of losing everything with any sea-level rise. The report from C40 Cities touches on other cities that are at risk during climate change and discusses ways to mitigate these disasters, through upgrading buildings, implementing task forces whose only agenda is climate change, amongst other policy changes.

Vancouver

Vancouver does not face as many risks as these other cities, much of its population is at higher elevations, and its population is much smaller than a city like New York. This is shown in the maps at the right (click here for New York Population Map, Low Elevation in New York Map, Vancouver Population Map, or Low Elevation in Vancouver Map. The entire population of Vancouver is above sea level (albeit not by too much) unlike some other cities. Even with that known, Vancouver is still one of the world’s 20 cities that are most vulnerable to climate change, according to a report by C40 Cities. In 2012, Vancouver implemented a comprehensive climate strategy plan which encouraged the creation of new bylaws that have restrictions that ensure that new buildings are constructed at safe elevations. Hopefully Vancouver will continue to implement these rules about safe and proactive building. For my project, I will look at large sea level rises. In the photos comparing New York and Vancouver to the right here, it is looking at elevation levels of less than 5 m. There are not agreed-upon projections of any sea level rise up to a level of 5 m by 2100. In the comparison, it is simply comparing low elevation.

https://www.c40.org/other/the-future-we-don-t-want-staying-afloat-the-urban-response-to-sea-level-rise
Figure 2: Cities projected to receive at least 0.5 meters of sea level rise by the 2050s under RCP8.5, C40 Cities


Figure 3: New York City Low Elevation and Population
Figure 4: Vancouver Low Elevation and Population

Introduction

Sea Level Height

One of the greatest challenges facing society today is climate change. Temperatures are rising around the globe. One outcome of climate change will be a rising sea level. With the temperatures rising, water will expand through thermal expansion, and ice will melt which will lead to higher sea levels. Despite the majority consensus around the existence of climate change and the accompanying sea-level rise, there is no consensus on the numbers around this. For predictions of sea level rise by 2100, the Intergovernmental Panel on Climate Change (IPCC) in 2007 predicted 0.18 - 0.6 m and in 2013 predicted 0.26 - 0.98 m. The National Oceanic and Atmospheric Administration (NOAA) in 2012 predicted a sea-level rise or 0.2 - 2.0 m, and in 2017 predicted 0.3 - 2.5 m. These predictions will always differ from each other depending on what climate models, initial conditions, and a wide variety of other factors that they are using to calculate these. These levels are unprecedented in our history. Before now the levels of sea level rising has been approximated as being 0.6 mm - 3.3 mm/year. There is a gap in knowledge with respect to BC’s coastlines and how a rising sea level will affect them.

Introduction

Vulnerability Indices

2008 BC Ministry of Health Emergency Management Branch Study

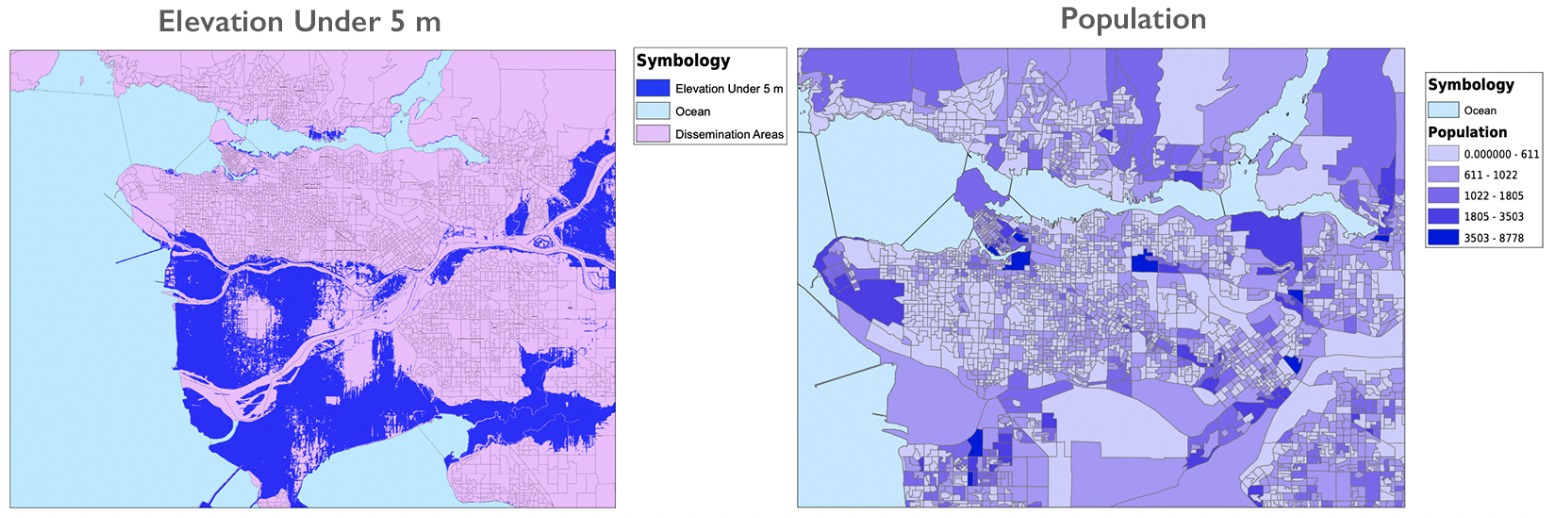
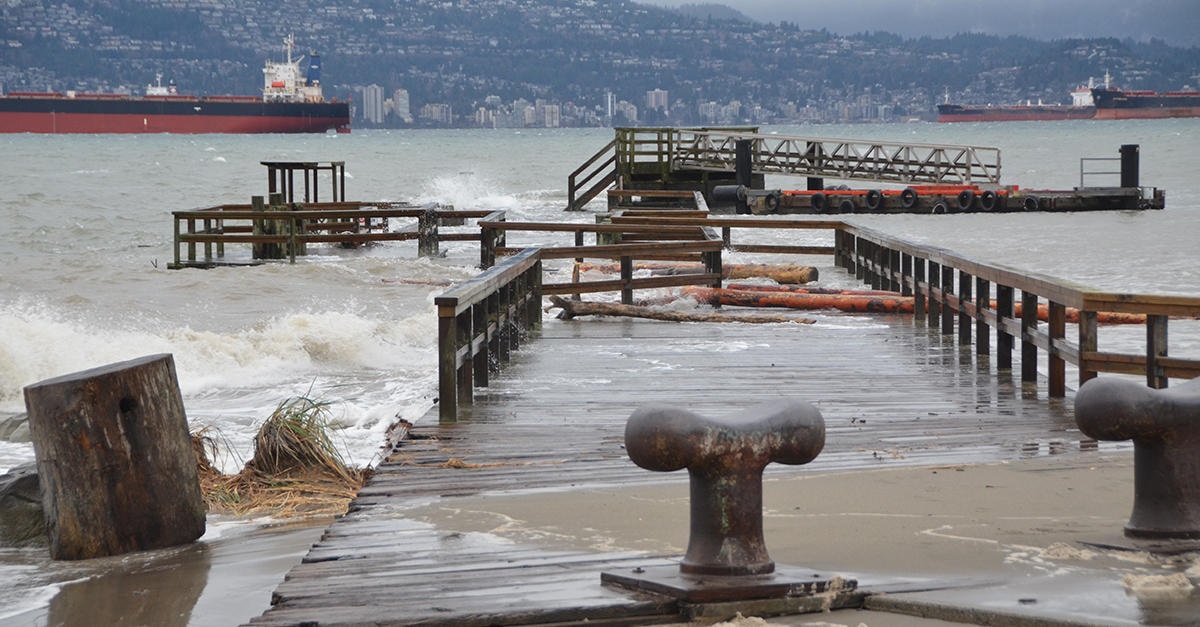
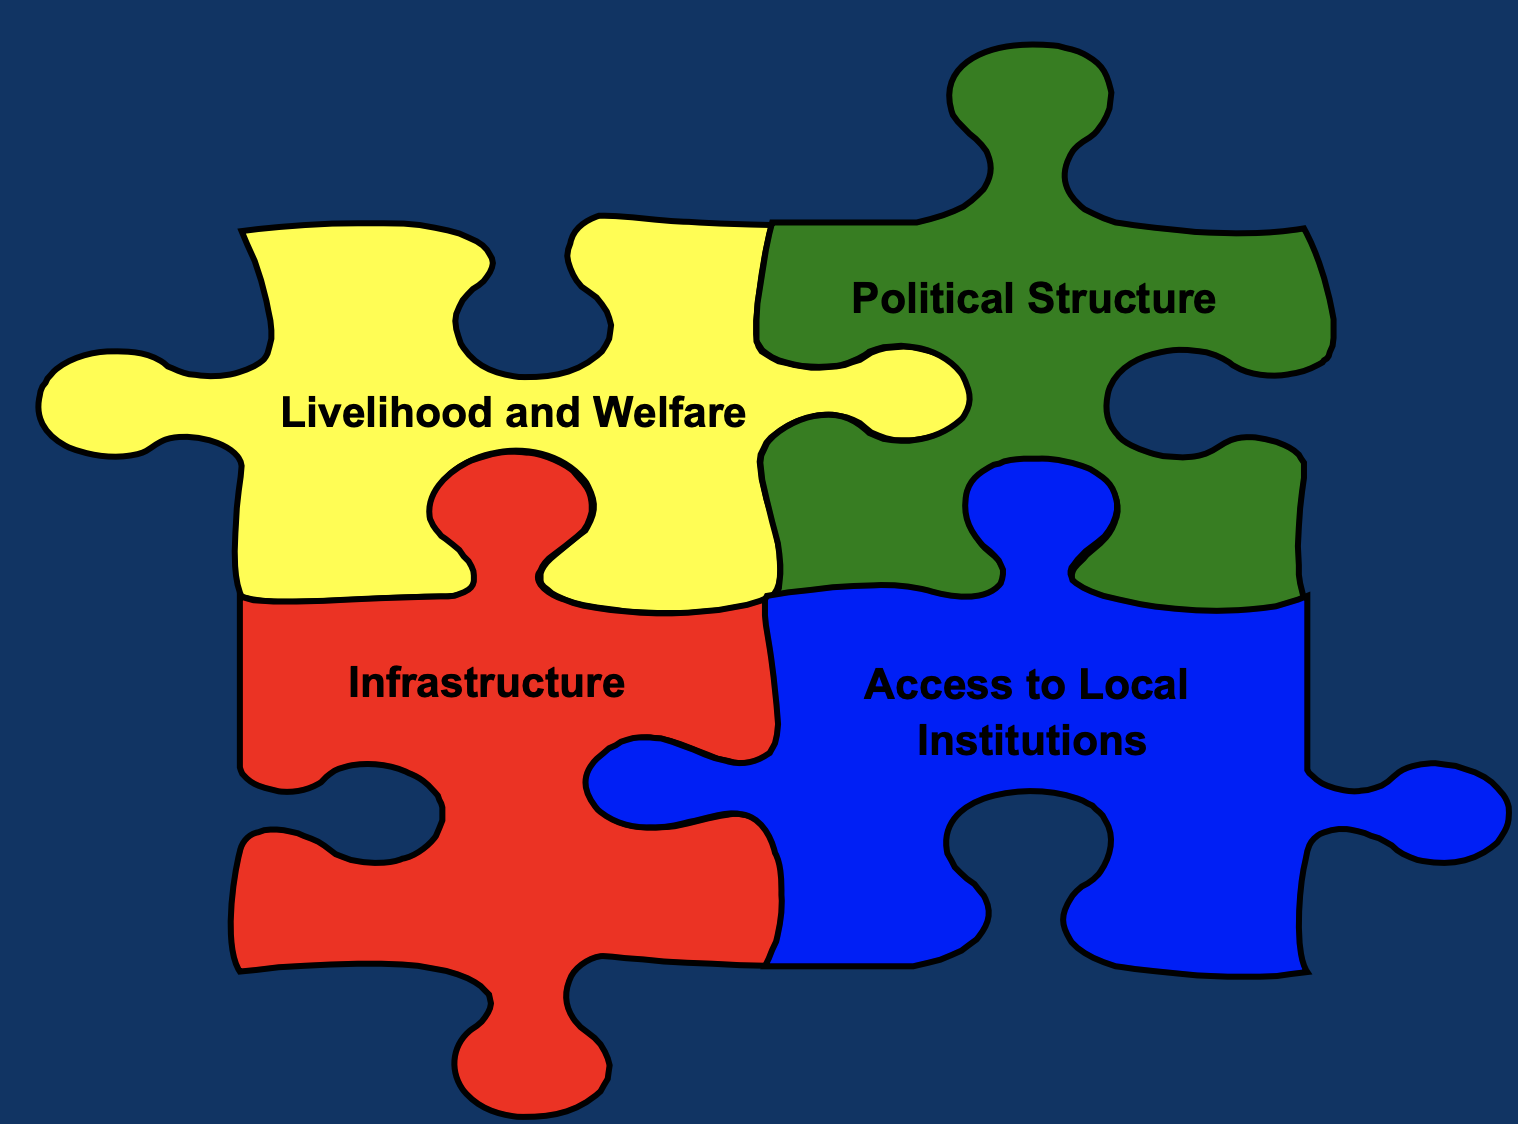
In 2008, the BC Ministry of Health Emergency Management Branch did a study on human vulnerability to climate change. Emily Nixon created a vulnerability index on many different factors, including, age, primary method of transportation, language spoken, level of education, whether individuals had recently immigrated, family economy, among others. Nixon looked at three scenarios of sea level rise: a best case of 0.09 m, a worst case or 0.88 m , and a catastrophic case of 6 m. They found that 186, 900 people live in areas that would be affected by sea level rise. As well, they mentioned that both the port of Vancouver and the Vancouver International Airport would be greatly affected and potentially submerged by these levels of sea level rise. Nixon determined places with low vulnerability, medium vulnerability, and high vulnerability and gave those places a value of 10, 20, or 30, respectively. For example, she gave individuals between the ages of 0-19, and over 64 a vulnerability of 30 while individuals from the age of 19 to 64 were given a vulnerability value of 10. The study was high-level and as such, the data for the vulnerability indicators is not available. The areas that were found to have the highest vulnerability were Northeast Vancouver, Downtown Vancouver, Southeast Vancouver, Downtown Vancouver, and North Vancouver. This study heavily influenced and inspired my project. For much of my process and figuring out what was going on, I looked at 0.09, 0.88 and 6 m increased in the sea level, following Emily Nixon’s parameters.

Social Vulnerability Index for Disaster Management

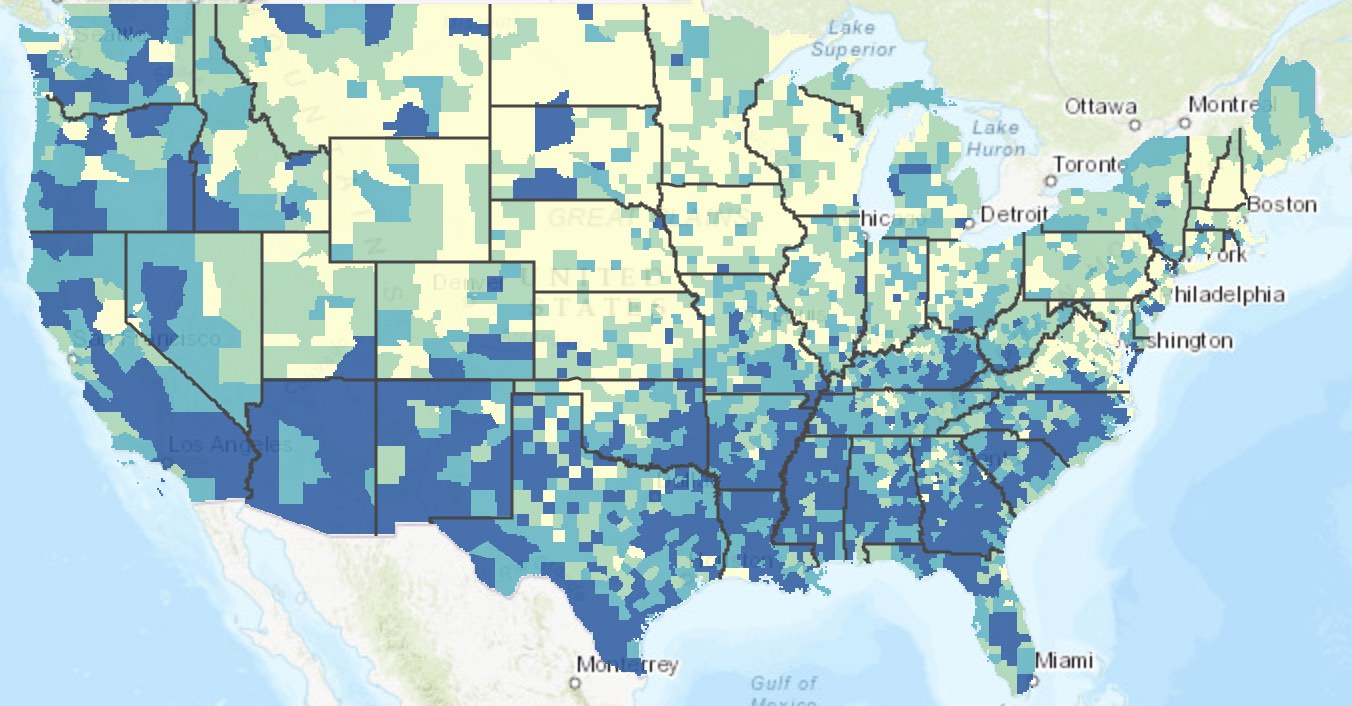
In a paper published in 2011, several authors look at creating a social vulnerability index for communities in the United States. Recognizing the lack of valuation of human life in risk management, these authors sought to alter that way of thinking. They listed age, income, strength of community, and neighbourhood characteristics as some of the factors that they were considering that contribute towards vulnerability to hazards. Individuals with higher vulnerability indices are going to have a tougher time during any disasters, as well as after during recovery. For example, as given in this paper, after Hurricane Katrina, many low-income individuals were stranded as they did not have access to personal transportation. In order to create their vulnerability index, they used 15 census variables and ranked each census tract across the United States from highest to lowest. Then, a percentile rank was calculated for each census tract which included individual percentile ranks for the different factors and contributed to the overall social vulnerability index for all of the census tracts.

Vulnerbility Puzzle
Figure 6: BC Ministry of Health's Vulnerability Puzzle from Emily Nixon's Presentation
CDC's Social Vulnerability Index (SVI) Map.
Figure 7: CDC's Social Vulnerability Index (SVI) Map