Data

Introduction

Descriptions

Social Vulnerability

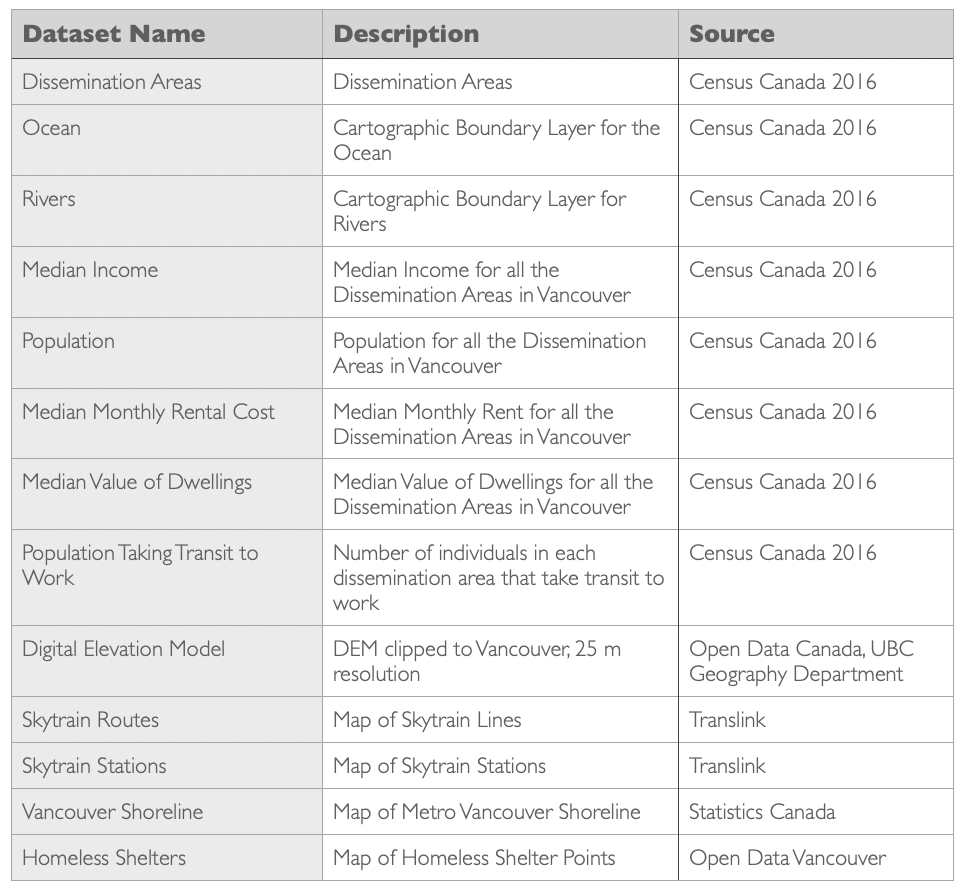
To look at social vulnerability, I went to Canadian Census data. I decided to use dissemination areas rather than census tracts because they show more variability as they are smaller areas. Of course, there is the potential modifiable areal unit problem, but I will discuss that further in the results section. I chose to look at population, average age, median income, median monthly cost of rent, transit density (number of commuters that usually take transit to work divided by the population), and the median value of dwellings.
Sea Level Rise

In regards to sea level rise, I have been looking at two different features: the shoreline, and a digital elevation model, clipped to Vancouver. My main analysis surrounded the DEM, in my methods section I go into detail on reclassification and conversions that I went through to come up with a layer that could be used in analysis with census data.

Miscellaneous

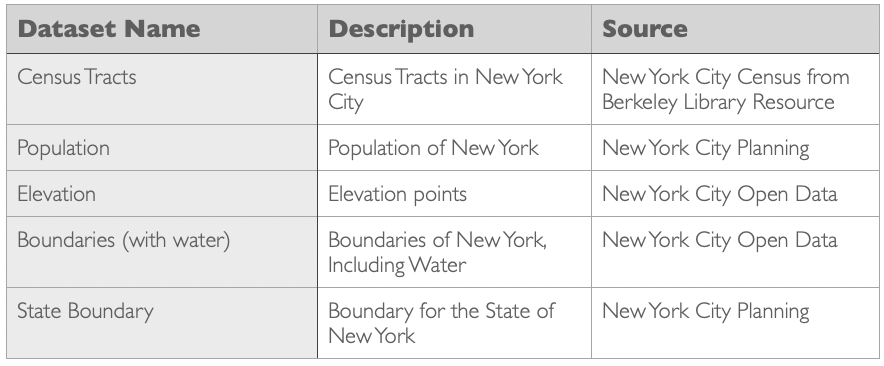
I sought out the locations of homeless shelters from Open Data Vancouver and downloaded a KML file from translink of the skytrain station locations and the routes. I wanted to look at the homeless shelters in Vancouver and see where they are located, if they would be vulnerable to a rise in sea level. I wanted to look at the translink skytrain data to see if they too would be vulnerable to a rise in sea level. On the previous page, I compared New York to Vancouver, the data source information is in a table below along with all of the information for Vancouver data sources.

Data Tables

Figure 1: Sources for all of the data in my Vancouver Map and Analysis
Figure 2: Sources for all of the data in my New York Map